BOARD WORKPLACE HEALTH & SAFETY PERFORMANCE REPORTING
This week I had planned to post Part 2 of a 3-part series for directors on investing in mental health; however, in line with the end of quarter and boards reviewing quarterly results, I thought it timely to step back and take a look at board workplace health & safety (WHS) performance reporting. To do so, I’m have summarised a report published approximately one year ago by Safe Work Australia. The report was the result of a 3-year study into the role of accounting in WHS performance. The study has provided us with a set of suggested of indicators for WHS performance reporting for various levels of responsibility, stakeholders and organisational maturity – however, note that these indicators are not mandatory, but they are a big step in the right direction towards standardised reporting.
WHY BUSINESS LEADERS SHOULD READ THIS POST
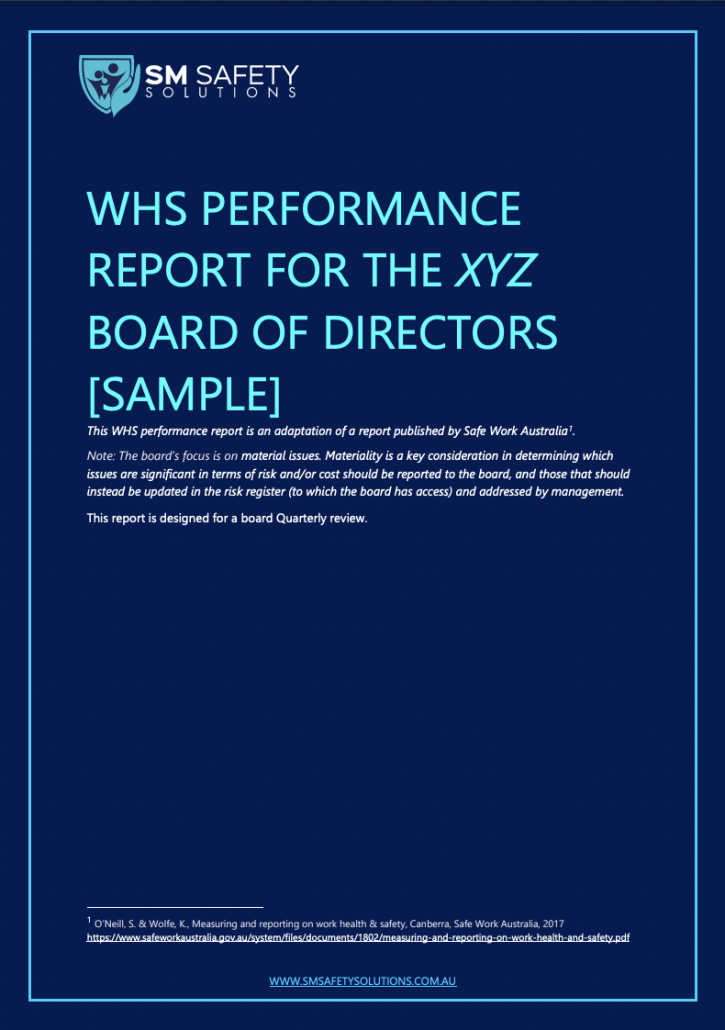
The two biggest problems I’ve seen in board WHS performance reporting are: the reporting doesn’t assist the board in making strategic decisions nor does it assist directors in compliance with their due diligence duties, specifically the due diligence obligations in the Australian/New Zealand workplace health and safety legislation. However, regardless of where you are in the world, whether or not you have a legislative obligation to exercise due diligence under your WHS legislation, if you are a director, the following framework for reviewing your WHS performance will be useful. While some of you may be comfortable that your reports are assisting you with the above, I still encourage you to read this post as I drill down into what directors should be looking at and why. I have also provided a sample board report as a free resource for today’s post.
NO STANDARDISED INDICATORS FOR MONITORING WHS PERFORMANCE
Currently there is a lack of standardised and accepted indicators to measure the WHS performance of organisations and businesses at the organisational level … and this is true globally. Think about that for just a second … there is no equivalent ‘gross profit margin’, ‘net profit’, or ‘current ratio’ in WHS performance reporting to measure and compare a business’ success in managing its health & safety. You may be thinking, what about injury rates such as lost time injuries? In a previous post (#4: Out with the Old (LTI), In with the New (injury and illness classifications) I discussed the clear pitfalls of relying on one-dimensional injury data such as lost-time injury frequency rates, not to mention there is no standard definition for a LTI which makes comparing data very difficult, if not worthless. It’s not all bad news though, WHS performance information can and is being reported on a voluntary basis, but reporting is often selective and inconsistent. This hinders comparisons of WHS performance and due diligence reporting over time and across organisations. As a result of the 3-year study into the role of accounting in WHS performance, we now have a set of suggested indicators for WHS performance reporting for various levels of responsibility, stakeholders and organisational maturity – although they are not mandated, it’s a step in the right direction. The 3-year study found:
- Medium-large entities are initiating risk mapping exercises to identify and integrate WHS risk into broader corporate risk management practices.
- WHS due diligence training for most officers was focused on legal exposure and failed to inform their general understanding of WHS or how their decisions influence WHS outcomes.
- Accountants tend to view WHS from a ‘siloed’ rather than integrated perspective and identify only direct WHS costs (e.g. compensation).
- WHS assurance practices vary widely. Many organisations are struggling to address the due diligence requirements for verification.
- WHS performance data is generally inadequate for effective decision-making, yet accountants do not readily lend their expertise to aid the innovation in non-financial WHS performance measures that could assist verification, guide strategy and better inform WHS decision making.
- Many accounting practices (procurement, resource allocation) do not include the adequate internal controls or consultation mechanisms required to ensure due consideration of the likely WHS outcomes.
Hence the need for a set of standard indicators.
Research has found that WHS performance data is generally inadequate for effective decision-makingClick To TweetGlobal Reporting Initiative 403: Occupational Health & Safety
Some of you may have heard of the Global Reporting Initiative (GRI), an international independent standards organisation that pioneered sustainability reporting. GRI helps businesses and governments worldwide understand and communicate their impact on critical sustainability issues such as climate change, human rights, governance and social well-being. The GRI Standard 403: addresses the topic of occupational health & safety impacts. The Standard outlines required and recommending reporting, but in itself is still voluntary reporting. While the GRI reporting does include reference to workplace injuries and illness, such as:
- The number of fatal work-related illnesses
- The number of recordable work-related illnesses
- A list of the main types of work-related illness.
and allows for international businesses to benchmark their impact on society, it is not a comprehensive list of indicators that will assist directors in their compliance obligations or in strategic decision-making.
CRITERIA FOR CHOOSING YOUR REPORT CONTENT
When selecting information to include in WHS reports, you should consider: the relevance for decision-making; data quality (reliability and validity); and cost effectiveness.
- Relevant: data is useful for informing decisions on issues that matter to the business or undertaking.
- It is material; of a size or importance that leaving it out makes a difference to the report user.
- it is attributable; allows managers to take action that can influence results.
- It is timely; relates to current performance.
- Reliable: data is accurate and unambiguous, free from error and free from bias.
- It can be measured consistently, making it comparable both over time and across organisations.
- It is clearly defined, easily understood and readily interpreted by users.
- Valid: data measures what it purports to measure. This means a measure has:
- Statistical validity; the data mathematically captures what the description says it captures.
- Face validity; is generally accepted as ‘fit for purpose’ (i.e. seen as fair by staff and managers (or stakeholders)).
- Cost effective: the cost of collecting the data does not outweigh the usefulness of that data.
Note: including information (data) that is immaterial in a report will actually reduce the report’s usefulness because the data does not add value, but instead adds noise and can obscure important messages.
DIRECTORS NEED TO KNOW …
While operational management require timely data on WHS risk and performance, such as implementation and effectiveness of WHS controls and initiatives, board performance reporting needs to provide relevant and material information that will inform strategic decisions and assist director’s in compliance with their legislative obligations. Under the Australian model Work Health & Safety Act (model WHS Act) (enacted in all Australian states and territories, except Victoria and Western Australia), directors are, by default of their position, considered officers, and are therefore required to exercise due diligence to ensure that the business or undertaking complies with its health and safety duties. There are six due diligence obligations in the model WHS Act that ensure that WHS considerations are integrated seamlessly into an organisation’s business model, particularly into its decision-making processes. Board reporting should provide directors with information on risk management and assurance as to the implementation and success of WHS strategy, WHS policy and internal controls. Specifically, reporting should cover:
- Information about how up-to-date an organisation’s WHS risk picture is: involving officers constantly refreshing their knowledge of general WHS concepts and practices and their understanding of WHS risk associated with the business enterprise
- Data relating to WHS performance: understanding processes of hazard identification, prioritisation and risk control, and the outputs of the WHS performance management system.
- Information relating to oversight and assurance: the verification of legal compliance and the implementation and effectives of managerial and resource allocation processes needed to eliminate or minimise risk.
SIMILARITIES BETWEEN FINANCIAL REPORTING AND WHS REPORTING
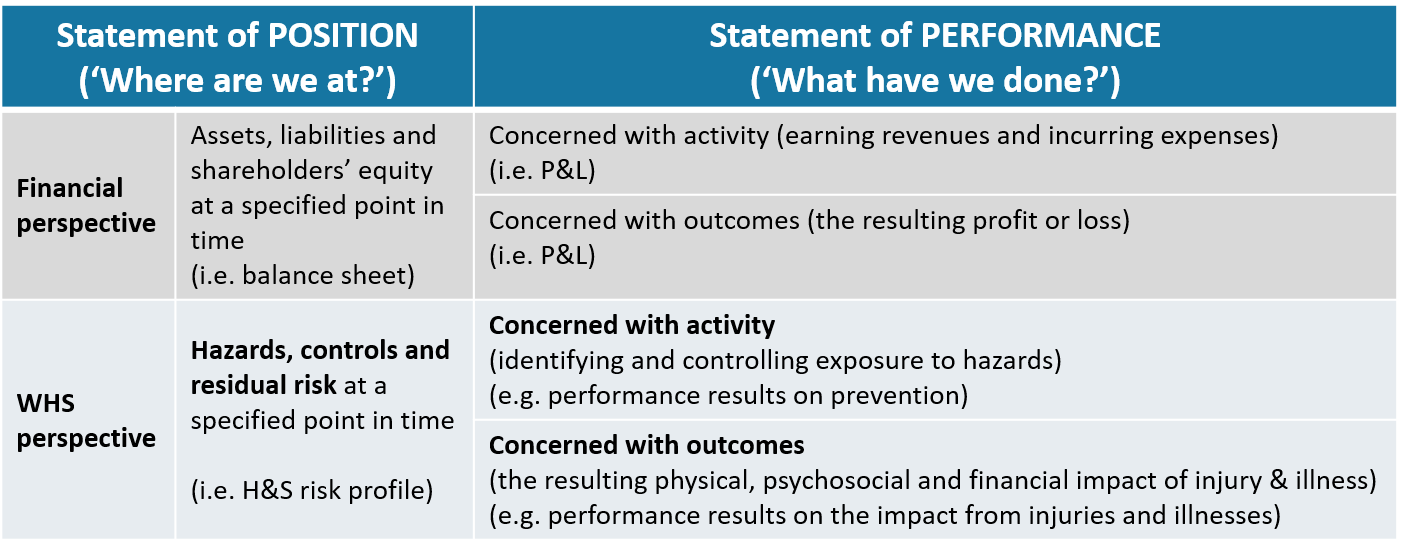
One of the best ways I’ve seen WHS performance reporting summarised for leaders is in the table below, which provides a comparison of WHS performance reporting and financial reporting. The concept is, just as financial reporting provides essential information about the financial performance (i.e. ‘profit and loss’ over a period) and position (i.e. ‘balance sheet’ at a point in time) of the business, WHS reporting should provide a clear understanding of the business:
- WHS performance (i.e. actions and outcomes over a period) and
- WHS position (i.e. health and safety at a given point in time).
The table below summarises these two perspectives:  Image adapted from Safe Work Australia
SUGGESTED FRAMEWORK FOR BOARD REPORTING
It’s important to note that while I will outline the framework proposed by O’Neill & Wolfe, on behalf of Safe Work Australia, that you can use to identify your board reporting indicators, each organisation needs to identify and use the lead and lag indicators that can best inform the particular challenges and issues it faces – use the WHS Position and Performance as a guide and check out the FREE RESOURCE for today’s post which is a sample board report. In addition, much of your reporting will be shaped by your organisation’s culture – the more mature the reporting; the more mature the organisation’s approach to the management of health & safety. There are four categories for Board WHS peformance reporting:
Category 1: WHS risk picture
This section aims to ensure directors are apprised of specific and significant changes in: WHS regulation, technologies, practices (relevant WHS matters), and organisational hazards and risks (organisational risk profile).
- Indicators of change: where significant structural change, financial constraints, growth or downsizing is occurring, the likely impact on WHS should be highlighted/discussed. This may include discussion of a formal risk assessment, consultation plan, implementation plan.
- Relevant information may be sourced internally (e.g. via inspections, audits or incident analysis), or externally (e.g. from scanning legal, WHS and news sources). Information may be quantitative and/or qualitative.
Note: The board’s focus is on material issues. Materiality is a key consideration in determining which issues are significant in terms of risk and/or cost should be reported to the board, and those that should instead be updated in the risk register (to which the board has access) and addressed by management. At a minimum, this section of the board report should always include:
- ‘New top 3 (or 5)’ – To raise awareness and due consideration of emerging threats or examples of potentially significant regulatory/operational issues identified via external scanning. KPIs may be included for context.
- ‘Our risk update’ – To raise/maintain awareness of the organisation’s critical risks and highlight any significant changes in the organisation’s injury or risk profile. Keep explanations brief.
Board training issues may be flagged in this section, as and when necessary. For example, when a board member has not completed a WHS induction, or where identified an important training was scheduled but had not been delivered.
Category 2: WHS position
This section provides information about the state of ‘health and safety’ of the organisation at the end of the period. That is, the status of risks, controls and residual risk regarding the implementation and effectiveness of WHS policy and strategy, including those relating to the allocation of financial and human resources. This section should summarise the organisation’s success in meeting its obligations to ensure workers’ health and safety. Critical here are KPIs relating to critical controls that seek to eliminate or minimise WHS risk or reflect event reports (ERs) that remain unresolved at the end of the month (aged, if possible).
- Indicators of critical defences: lead and lag indicators of selected critical risk-control activities. It is important to focus primarily on significant changes and new risks, not to simply replicate every available measure from the WHS managers’ report in the board report. Where notable changes in risk or performance are rare, the board report might include a lead and lag indicator of a few different critical defences each month.
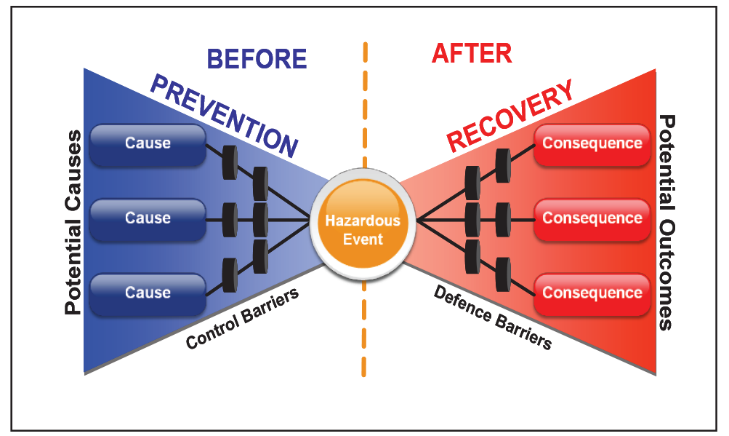
I recommend the Bowtie approach to identify your critical risks and supporting preventative and mitigating controls. 
Category 3: WHS performance
This section should summarise the business’ risk management efforts and the subsequent injury and illness outcomes. That is, its success in meeting its obligations to deliver the resources and processes needed to ensure workers’ health and safety.
- Injury/illness: the number of actual injury cases, by severity (not an aggregated injury rate) is appropriate. This allows officers to make informed assessments about different aspects of WHS impact and reinforces that each and every recordable injury represents a failure to ensure WHS.
Carefully prepared tables, bar charts or graphs can ensure injury data is both concise and useful.
- Risk elimination or minimisation efforts: information about the actions taken to identify and eliminate hazards/minimise risk. May include KPIs/details relating to the implementation of WHS programs, initiatives, controls etc, climate survey results, incidents investigated and / or event reports (ERs) closed during the period. (For example, this could include a graph of ERs closed with categories reflecting the ‘hierarchy of control’ levels that applied to those solutions.)
- Indicators of safety inspections: include activity and outcome details for internal or external performance audits and inspections (e.g. KPIs relating to ‘opportunities for improvement’ identified or metrics such as average safety inspection conformance).
- Financial indicators: of the success or failure to ensure WHS compliance. This includes regulatory fines and penalties and updates on legal fees, workers’ compensation and (self-insurer) medical costs relating to Class 1 injury or illness (see my post #3 Out with the Old Injury (LTI), In with the New Injury Classifications).
Other direct or indirect costs may be included if desired. Where trends in compensation costs are stable over time a short sentence may suffice. For example, “compensation claims, and costs are unchanged at 3 and $19,000/ month.” Note: KPIs such as LTIFR and total lost workdays may be included here, particularly if total days lost includes a range of non-productive time (e.g. days lost to injury or illness, absenteeism and sick leave), although it should be clear that these measure lost productivity not injury, nor safety – again see my post #3.
Category 4: WHS assurance
This section provides assurance regarding the systems that seek to ensure WHS. KPIs relate to governance processes (rather than management processes):
- Indicators of critical defences: lead and lag indicators of selected critical risk-control activities.
It is important to focus primarily on significant changes and new risks, not to simply replicate every available measure from the WHS managers’ report in the board report. Where notable changes in risk or performance are rare, the board report might include a lead and lag indicator of a few different critical defences each month.
- Indicators of audits and assurance: include activity and outcome details for internal or external compliance audits or external, for example KPIs relating to ‘opportunities for improvement’ identified or metrics such as average safety inspection conformance.
Later in the year, I will look to review indicators for external reporting, such as those indicators you should provide in your annual and sustainability reporting. If you want to stay informed, subscribe to my Newsletter HERE and you’ll be the first to know when it comes out. Now it’s your turn: What indicators are included in your board reports that help the board make strategic decisions or comply with director due diligence obligations? Leave a comment below and let me know. Remember, your story and/or thoughts may lead to someone’s meaningful breakthrough and it all contributes to this audience knowing What to Ask, and When to Act #knowWTA Important: share your thoughts and ideas directly in the comments. Links to other posts, videos, etc. will be removed. Thank you so much for adding your perspective to the conversation! Thanks for reading!
Welcome!
I’m Samantha
I teach board members and executives how to lead with heart and put people first, by leading safe & healthy work. Stick around and I’ll share with you the skills, knowledge and mindset you need to know what to ask, and when to act and lead with confidence.
RESOURCES
YOU MAY ALSO LIKE…
FEATURED CONTENT
[text-blocks id=”4249″ plain=”1″]


Let us know what you have to say:
Want to join the discussion?Your email address will not be published.